5.0
Reviewed Jun 1, 2020The content was excellent and inspiring me to try Plotly express in the other projects that I am working on too.

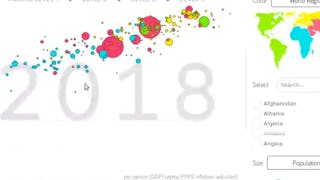
Welcome to this project-based course on Data Visualization with Plotly Express. In this project, you will create quick and interactive data visualizations with Plotly Express: a high-level data visualization library in Python inspired by Seaborn and ggplot2. You will explore the various features of the in-built Gapminder dataset, and produce interactive, publication-quality graphs to augment analysis. This course runs on Coursera's hands-on project platform called Rhyme. On Rhyme, you do projects in a hands-on manner in your browser. You will get instant access to pre-configured cloud desktops containing all of the software and data you need for the project. Everything is already set up directly in your internet browser so you can just focus on learning. For this project, you’ll get instant access to a cloud desktop with Python, Jupyter, and Plotly Express pre-installed. Notes: - You will be able to access the cloud desktop 5 times. However, you will be able to access instructions videos as many times as you want. - This course works best for learners who are based in the North America region. We’re currently working on providing the same experience in other regions.
The content was excellent and inspiring me to try Plotly express in the other projects that I am working on too.
Awesome experience i felt in 1 hour. Lots of things i have learnt from Plotly.
excellent hands-on training for python and data visualization lovers
Everything is clearly explained, It's delightful to hear and follow the steps by Instructor. Loved it !!
I have learn a lot . This is very informative and now I am very happy .
nice session. learned something about plotly library .
thanks dude!I was struggling with this really badly..it will help me while working with kaggle notebooks and competitions..:)
It's amazing. This is the first time I see data animation. It's really interesting.
Showing: 20 of 50
Not good. It's a simple follow-along tutorial for creating a couple of graphs, every task can be summed up into one line of code or just an argument change. The platform had various bugs. For instance, the all caps key is not available, the quality of the video and audio is not that good, the virtual computer resolution is not optimal, etc. A good primer for Plotly express but it is just an exercise.
Cloud desktop is a mess. No one is there to assist.
Very fun and very rewarding!
Best Explanation of plotly
All the content and especially the exercises are available on the Plotly website. This is not original content.
This Course is by far the BEST of all Coursera Projects I have attended. Almost all other instructors just type the code and say what happens. But Snehan Kekre has even explained WHY each code is typed in and how to edit them. Excellent Job.
The project neatly explains how to use animation charts and other types of charts using Plotly. The course instructor could have taken more time to fully explain the concepts behind it, but still, you will get a basic idea from the project.
Explanations were quite good. It took more time to figure out how to use the environment than actual project . I used kaggle to complete the project but the content itself was good It was just right for me.
I guess this project is a good one start in plotly, it explain main of the atributes that you gonna need for most of the plots, but for most advanced and prettier ones you should see the documentation.
thanks dude!I was struggling with this really badly..it will help me while working with kaggle notebooks and competitions..:)
The content was excellent and inspiring me to try Plotly express in the other projects that I am working on too.
Everything is clearly explained, It's delightful to hear and follow the steps by Instructor. Loved it !!
It's amazing. This is the first time I see data animation. It's really interesting.
I have learn a lot . This is very informative and now I am very happy .
excellent hands-on training for python and data visualization lovers
One of the best guided projects I tried, highly recommended
nice session. learned something about plotly library .
Love the explanation and the flow of teaching..
very good course and tutor, beginners friendly
Great project. Super interactive and fun!